![]()
![]()
![]()
![]()
![]()
![]()
![]()
![]()
2001 Census Matrix Tools walkthrough
![]()
Back to Census Matrix Tools The Census Matrix Tool produces trip matrices for journeys to and from work based on sources including the Journey to Work data obtained from the census. The user sets up a zone system against which the Census data is processed so that only trips between and within the zones of interest are processed. As well as creating a zone system, the user creates a build specification that has the year of interest, the type of day and month and home to work or work to home journeys. A choice is made between having the output broken down by mode or by mode chain and it may be broken down further by household car availability. The Census data file is then read and the output matrix is created. In order to run the program, the user needs to: Create a build specification, Create a zone system, Build the matrix, and then they may View the resulting matrix.
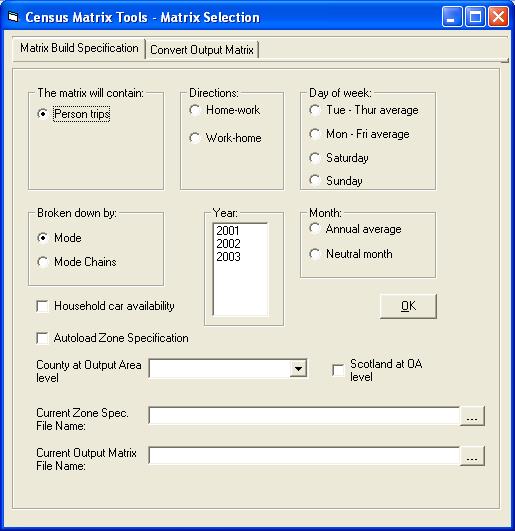
Creating a build specification
As well as a zone structure, the program also requires a Build Specification. A new one may be set up by clicking on the New Project option on the File Menu. The form below is displayed allowing the user to choose which year they want the matrix to be calculated for with the choice being from 2001 to 2003. The user also chooses whether to have home to work or work to home journeys. A choice is made between four possible types of day. The matrix may be calculated for a Saturday, a Sunday, a neutral weekday (meaning Tuesday to Thursday), which eliminates the distortions caused by the Monday morning and Friday evening rush hours being untypical or an average weekday, which is the Monday to Friday average. A choice must be made for all of these options and an error message is displayed if the user attempts to build a matrix without making all the necessary choices. If this happens, make the selections and click on Tools Build again. The user may also choose to have the matrix broken down by car availability. The Build Specification also allows the user to choose to have the results broken down by mode chain. The mode chains are described. If this choice is not made, then by default the results are broken down into the eight main modes described .
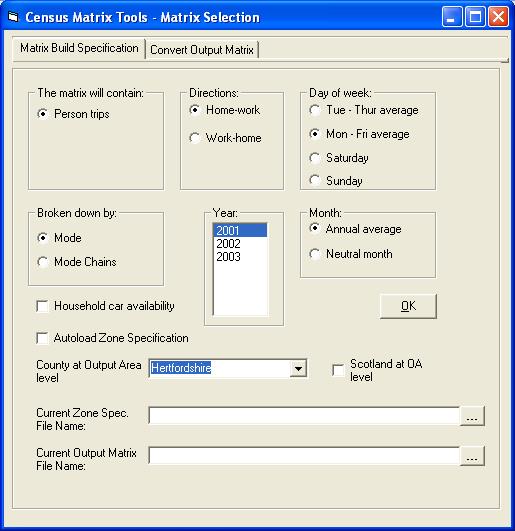
For this walkthrough, set up the form as shown below:
Creating a zone system
This is done using a Treeview, a hierarchical structure similar to that used by Windows Explorer. The initial tree showing the whole of Britain is loaded by clicking New on the Zone Specification sub-menu on the File Menu. After the tree has finished loading, it displays the counties underneath the words Country - GB. Above this are Dustbin and All. Each of these items is termed a node.
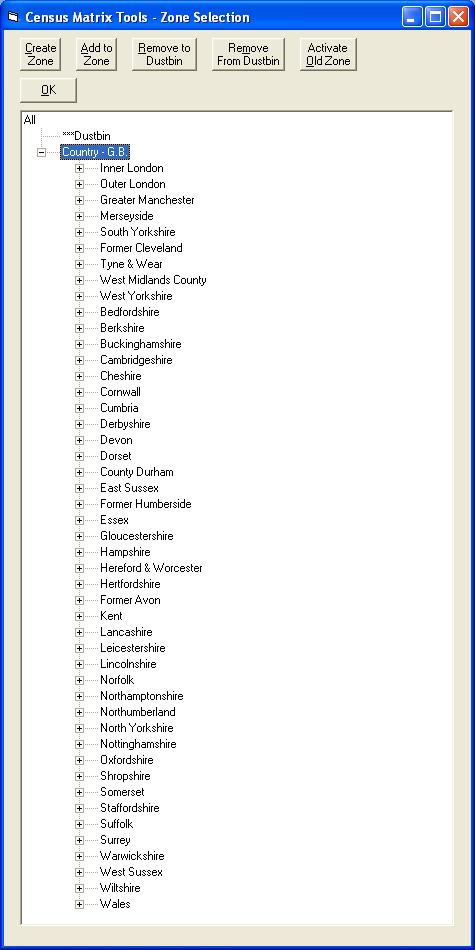
Each county is divided into districts and each district into wards. To expand a node and reveal the next level below it in the hierarchy, e.g. the districts within a county, click on the plus sign immediately to its left. At the end of the text is a code that is unique to each node. In the case of a ward this is the standard six-character ward code. Output areas have a ten-character code.
The county required at Output Area level is selected in the drop down box on the Build Specification form before clicking New on the Zone Specification sub-menu. This county will then have its Output Areas attached to the wards and the rest of the country will be available down to ward level. The county must be selected before clicking New on the Zone Specification sub-menu or a Ward level only Treeview will be loaded.
Any node that the user is not interested in may be removed by clicking once on its text and then clicking on the Remove to Bin button. The node and all its substructure are then moved to the dustbin. Try this with Cornwall and Devon:
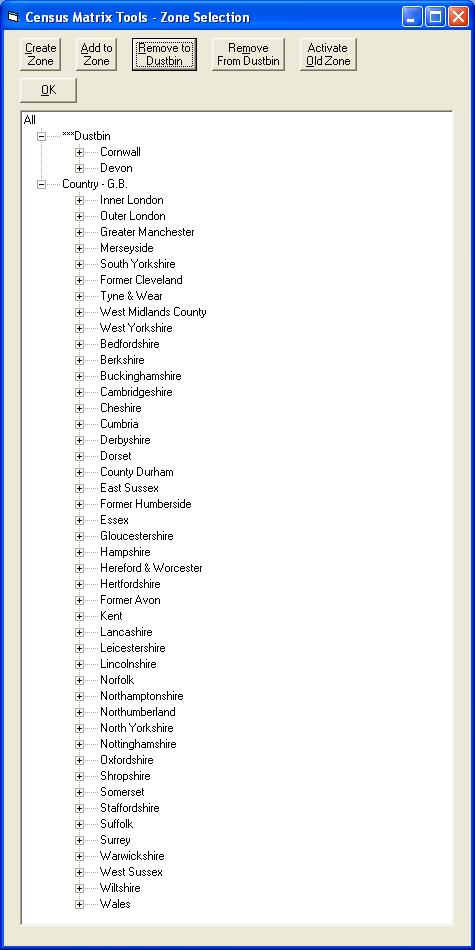
A zone in the output matrix is any node not in the dustbin that is collapsed - i.e. one whose substructure is not visible and which has a plus sign to its left. Expanding the node means that it is no longer a zone - instead each of the nodes attached to it becomes a separate zone. Expanding a county therefore means that each district within it becomes a zone.
A zone does not have to be a node in the initial tree. Users may create their own user defined zones including any nodes that they wish. To do this click on Country - GB and then click on the Create Zone button. A box will appear asking the user for a name for the zone. Enter a name and click OK. The name will then appear attached to the selected node in the tree. It will be in capitals, indicating that it is a zone created by the user. The user may then add any node from anywhere in the tree to the user zone by clicking on the text of the node and then clicking on the Add to Zone button.The user may create any number of such User Defined Zones, and the Add to Zone button will always add the selected node to the most recently created User Zone. If the user wants to add a node to one of the previously created zones, this is done by clicking the desired User Zone and then clicking the Activate Old Zone button. All nodes moved using the Add to Zone button will then be put in the selected User Zone until another User Zone is activated. The currently active User Zone is indicated by three asterisks, which precede its name. As with any other node, the contents of the user zone will be treated as a single node if it is collapsed but as separate zones if expanded.
For example, a user might want to divide the East Midlands region into two separate zones instead of having each of its counties as a zone. To do this, click on Country - GB and then on Create Zone. Name the zone (e.g. East Mid Zone 1) and EAST MID ZONE 1 will appear at the bottom of the Treeview. Click on Leicestershire, then on Add to Zone to put it in the EAST MID ZONE 1 zone and repeat for the other counties to be put in this zone. Then click on the Country - GB again, create another user zone (e.g. East Mid Zone 2), which will be placed below EAST MID ZONE 1 and move the remaining East Midlands counties into it.
When the zone system is complete, click OK to close the window. Give the file a name to save it as.
Building the matrix
To build the matrix, give it a filename on the Build Specification form. It should have a .txt extension. Click the Build Matrix option on the Tools menu.
Viewing the matrix
When the build is completed, the matrix can be opened and viewed in a text editor.
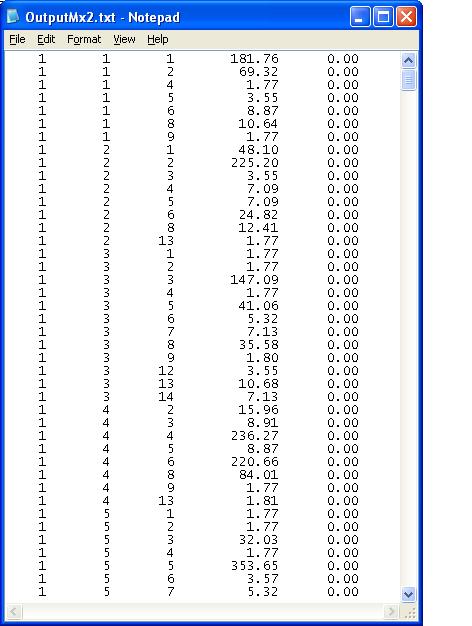
The columns are as follows: 1 - Market Segment; 2 - Origin Zone; 3 - Destination Zone; 4 - No of Trips; 5 - Variance
The Market Segment number signifies the mode.
- Train
- Underground
- Bus
- Car driver
- Car passenger
- Motorcycle
- Pedal cycle
- Walk
Matrices broken down by mode chain and/or car availability have more market segments, which are explained fully in the CMT manual.
Back to Census Matrix Tools